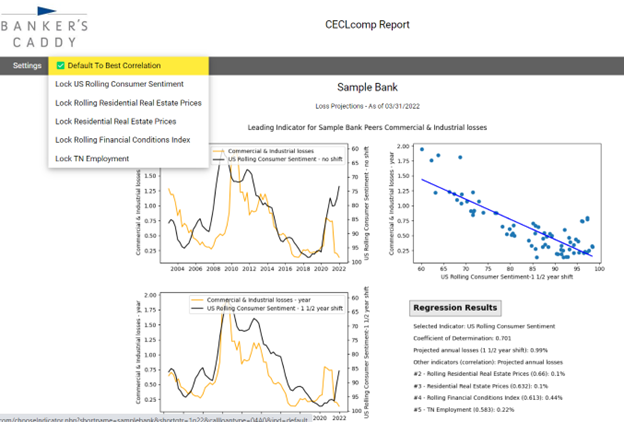
In addition to calculating lifetime loss rates, one of the biggest new changes FASB added to CECL is the requirement to use objective economic data to project losses into the “foreseeable future.” CECLcomp provides this calculation for you in the “Forward Looking Adjustment,” and now we have added a new enhancement that gives the bank greater control over this component of the model.
The model considers a number of different economic indicators (click here and scroll down to see full list) to calculate which ones were the best indicators of losses for the bank’s peer groups in the past for each pool, and how far in advance the indicator changes before they affect peer loss rates (possible lag periods are 1, 1 ½ and 2 years). The current economic ratio is then used to project losses into the near-term future.
Whichever economic indicator has the best statistical correlation with past losses is the default indicator to use for the forward-looking adjustment calculations. However, banks can now choose between the indicators. Often, the difference in correlation between the best indicators is relatively small, and sometimes the difference in projected losses can be relatively large. If the best indicator changes between one report and the next, it may have a substantial impact on the overall reserve calculation. To provide control and stability to the model calculations, a bank now has the option to lock in a certain economic indicator to be used for projected losses.
For example, unemployment is often one of the best indicators for certain loan pools. However, during COVID, the unemployment rate was disproportionately impacted by government-required quarantines. Because of these health-related reasons, the unemployment rate grew substantially, and the model would expect larger losses in the near-term future. Many banks saw the increase in unemployment during the pandemic as an aberration, though, and asked to use the next best economic indicator until the unemployment rate normalized.
In the past, we had to manually make programming changes in the model to accommodate this request. Now, we will show the five best leading indicators for each loan pool, and the bank has the ability to use the indicator with the best correlation or to lock in one of the five best indicators. This customization can be made by clicking the forward-looking adjustment number on the home page of the report and then clicking on one of the underlined projected loss rates (one of the first three years). This will show graphs of how the economic indicator and losses compared in the past. The top five economic indicators and their correlations and projected losses are listed on the bottom right of the page. To change the economic indicator used for the model, click on “SELECT ECONOMIC INDICATOR” on the top menu and select the desired indicator. At that point, the user can return to the report to make more changes or run the report to see the updated results (this takes several minutes).

Another time this feature may come in handy is when the model changes to a new economic indicator. Often, the economic indicators will improve or worsen in tandem, but not always. In the example above, the best indicator is the US Rolling Consumer Sentiment, which had a correlation of 0.701 and a projected loss rate of 0.99%. Suppose next quarter indicator #2 above (Rolling Residential Real Estate Prices) has a better correlation (it’s current correlation of 0.66 is not far behind). At that point, the projected losses would change from 0.99% to 0.10%, which would have a substantial impact on the model. At that point, a bank may want to stick with the previous indicator by locking it in, or they can accept the new indicator.
The easiest way to see if the economic indicator changed is to click on the Variances option in the top menu from the report to see if there was a large change from the previous report in the “Forward Looking Adjustment Change” column of the report.


Recent Comments