The Scale method was introduced in response to the objections of many community bankers that CECL is too difficult to implement for smaller institutions. Indeed, only banks with less than $1 billion in assets are eligible to use the model. While this approach simplifies the calculations, it makes some big assumptions that may eventually prove to be challenging for community banks that decide to use the model.
There are basically two major new calculations in CECL that are not part of existing incurred loss models: lifetime loss rates and objective forward-looking projections. The Scale method assumes that smaller institutions are incapable of calculating these components themselves, so they use large banks as a proxy.
All financial institutions with over $1 billion in assets are required to report their CECL reserves each quarter for six different loan categories. Since these big banks considered lifetime losses and objective forward-looking economic data in their calculations, the Scale method allows smaller banks to piggyback on those calculations by taking the average reserves of big banks for the six categories and adjusting from there.
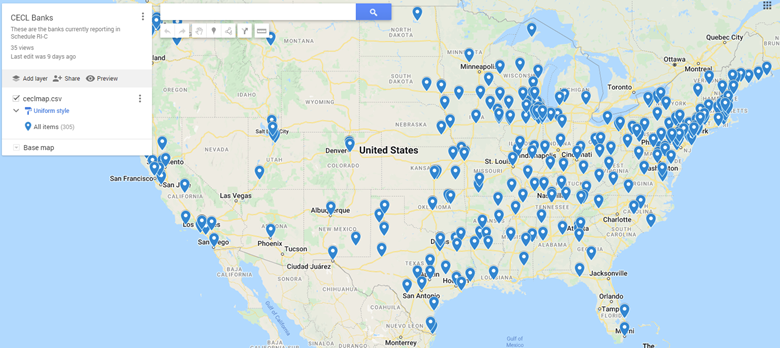
One big problem with this approach is the comparison group. Below is a map of the banks with assets between $1 billion and $10 billion that the Scale method is based upon:

Loan type granularity cannot be overstated as a consideration when choosing between the methodologies. The six pools available in the Scale method are construction, commercial real estate, residential real estate, commercial, credit cards and other. The WARM method, on the other hand, can calculate loss rates for all twenty of the pools listed in call reports.
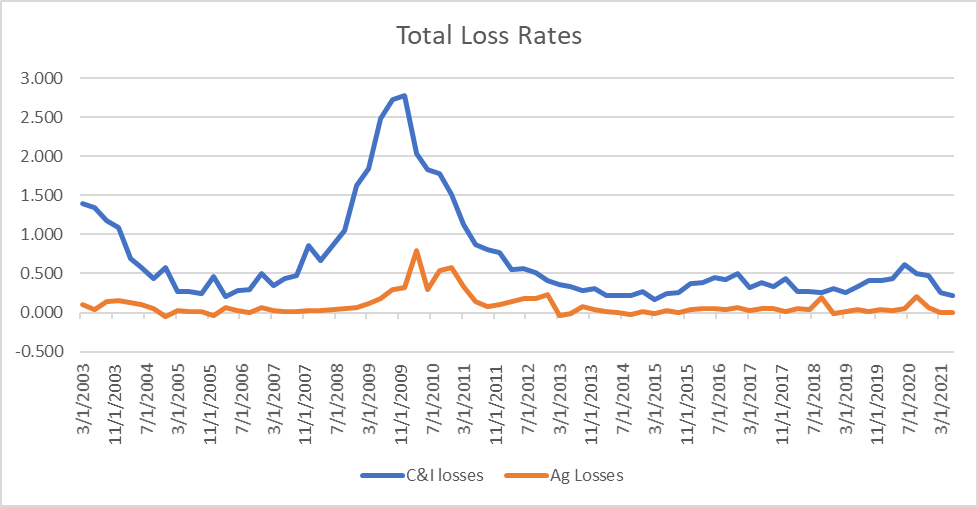
One example of why this level of stratification is critical is agriculture production loans. The Scale method requires banks to compare their agriculture production loans with commercial and industrial loans. Below is a chart comparing the total combined loss rate for ag production loans versus C & I loans for all banks in the country in recent years. C & I loss rates are often four times as high as ag loss rates. This disparity exists for other loan types as well.

The WARM method, by contrast, allows banks to be much more precise in calculating statistically meaningful historical loss rates by using a large number of similarly sized banks within a targeted geographic area and stratifying their loan pools more appropriately.
In addition to calculating appropriate historical and projected loss rates, CECL requires banks to calculate the remaining life of their loans and pools. These remaining life calculations are based on a bank’s existing loan portfolio and take into account scheduled loan payments, estimated prepayments and maturity dates. Larger banks and community banks often have very different loan structures, which makes it imperative to understand a specific bank’s remaining life calculations to get an accurate lifetime loss rate.

